From sensors to display, a journey towards usable satellite images
How to obtain useful satellite images
It all starts with a satellite equipped with the correct sensors
According to the Union of Concerned Scientists, around 6,500 satellites are currently orbiting above our heads, operated both by private companies and public actors. If satellites devoted to communications are the most represented (around 1,000 among the 2,666 operational satellites in April 2020), approximately 450 focus on Earth observation. Some constellation names may sound familiar, such as Sentinel, Landsat, Worldview, or GeoEye. This plurality is explained by the need for sensors and resolution diversity.
Two sensing systems can be distinguished: active and passive. [1], [2] and [3]
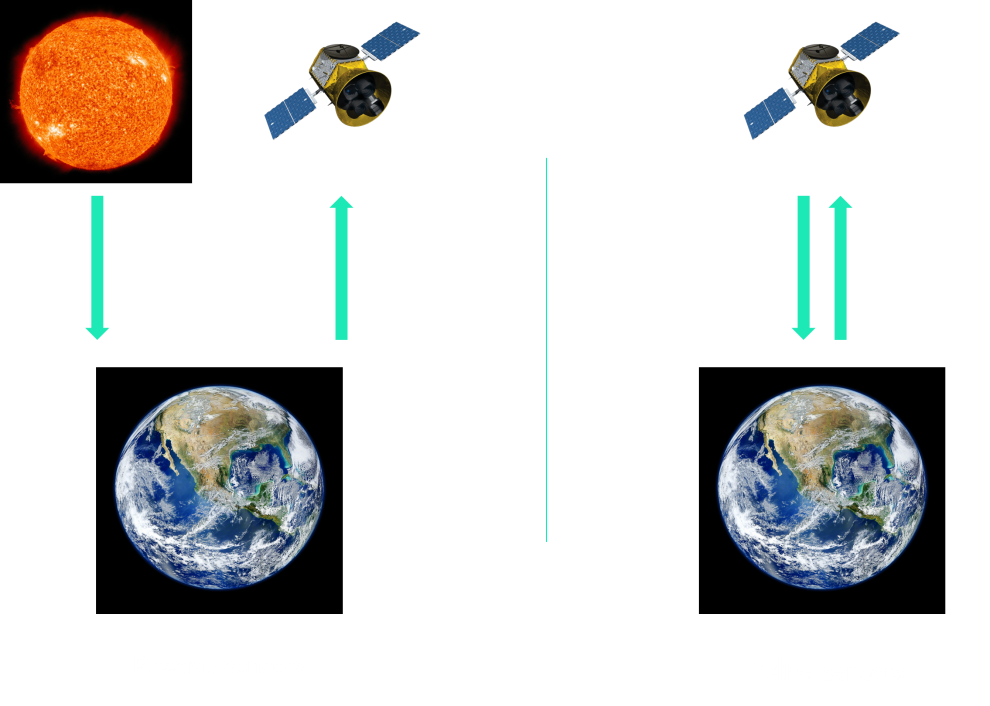
Passive sensors detect radiation reflected on the Earth’s surface and atmosphere and thus depend on solar radiation energy. A wide variety of wavelengths can be captured through these sensors, like those corresponding to blue, green, and red which lead to the creation of optical images. Other spectral brands, such as panchromatic (leading to black and white images) or near infra-red, are very popular as well. However, they are sensitive to illumination, as clouds and the absence of light (during the night) can largely damage the quality of the resulting images.
On the other hand, active sensors possess their own source of energy. They emit radiation and collect the reflected signal which makes them insensitive to solar radiations. The Synthetic Aperture Radar (SAR) and Light Detection and Ranging (LIDAR), based on the precision of the laser, are the most popular active sensors.
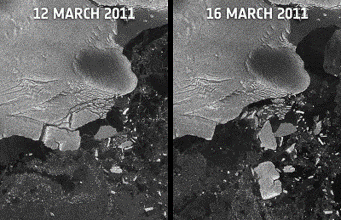
SAR Images of newly formed icebergs [4]
Satellites are characterized by the category of their onboarded sensors and their spatial and temporal resolutions, as presented in the graph below.
To improve the temporal resolution, satellite owners may deploy constellations. Planet Labs pushed this idea to the limit by deploying their Dove constellation (made of 250 satellites), which enables them to revisit a place 7 times per day on average.
Spatial and temporal resolutions

Even with brightness values captured, our journey to usable data is just beginning
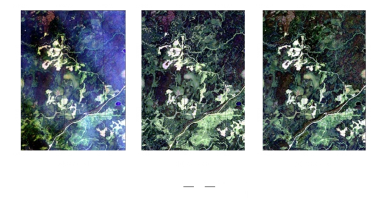
Once collected, image brightness values present some defaults due to the nature of sensors, the environment and the continuous movement between satellites and Earth. One usually splits the corrective treatments required to process data and to make it exploitable into three categories:
Radiometric
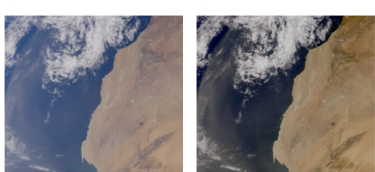
Atmospheric
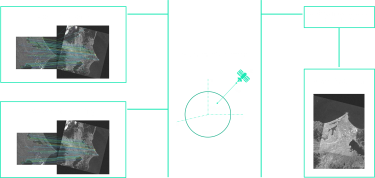
Geometric
Description of the different levels of post-processing treatments

As these corrections are fairly similar from one satellite to another, satellite image sellers more or less agreed on 4 processing levels, linked with specific corrections. Level 0 corresponds to the raw data but it is rarely used by itself. Level 3 is the most corrected level, looking familiar to the map we are used to.
As the image price is largely influenced by the number of post-processing treatments applied, defining the optimal level of processing depends on both the use case and the budget.
Soon enough, you will travel the world with your mouse!
With many actors of different nature - businesses, government agencies, research organizations, and universities - standards are required. These actors have therefore created the Open Geospatial Consortium (OGC), responsible for the normalization of standards on the exchange and storage of geographic data.
Once images are processed, geographic content needs to be stored in compliance with the OGC guidelines. The problem is… there are plenty of them! Why is that so? Let’s illustrate it with a simple example. Consider a simple point, defined by its latitude and longitude. This elementary object could be complexified by adding an altitude. Then, this point could become a line or even a group of lines forming a polygon. Besides, GPS coordinates are not the only way to store geographic information. In order to simplify not only the storage but also the management of geographic information according to these guidelines, GIS (Geographic Information System) was developed. PostGIS is a good example of such a system: this SQL extension enables you to store geometric features (points, lines, polygons…), query them, display them on a map or apply basic operations such as intersections…
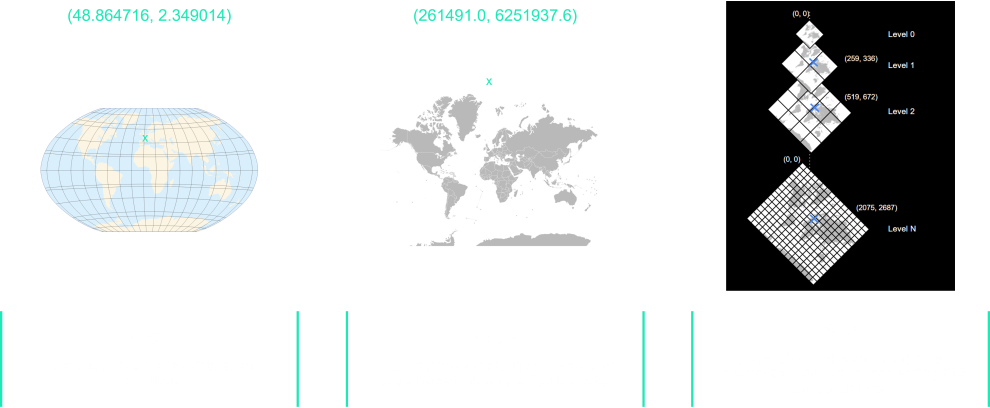
Other systems, like GoogleMaps or Maptiler, offer a different vision of the world, presented as a grid of tiles (ie: satellite images, usually a square of 256 pixels) available in several levels of zoom.
How to convert GPS coordinates to tile coordinates?
Let’s consider a point as a pair of latitude and longitude. This point can then be converted into a couple of coordinates in meters on the spherical Mercator (a flat representation of the Earth where the pole and equator lengths are the same). From these coordinates in meters, one can obtain the coordinates in pixels given a certain zoom. Then, by using the fixed size of a tile, it is straightforward to find the one showing the point we want. Thanks to this method, every map furnisher can quickly display a map, change the level of zoom, or move the map when the user requests it.
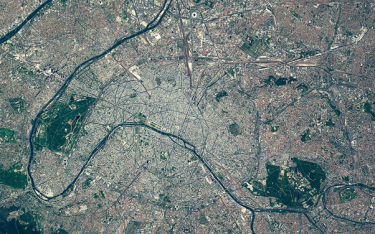
Illustration based on Paris location using [8] and [9]
Conclusion
Working with satellite images is not as easy as working with regular pictures. This article should help you define the type of images needed, the level of preprocessing required by the use case and the way to store and display them.
If you are now wondering: who owns the data and whether you should pay to acquire such pictures; we advise you to read the final article of our series on satellite and data owners and the concerns they raise.
References
The European Space Agency, accessed February 2022, <https://sentinel.esa.int/web/sentinel/user-guides/sentinel-2-msi/processing-levels>
Open Geospatial Consortium, accessed February 2022,
Nikiat Marwaha Kraetzig, UP42, January 15 2021, accessed February 2022,
<https://up42.com/blog/tech/a-definitive-guide-to-buying-and-using-satellite-imagery>
ESRI, accessed February 2022,
<https://www.esri.com/en-us/what-is-gis/overview>
Joseph M. Piwovar, ‘Getting your imagery at the Right Level’, pulish in Cartouche, No. 41, Winter 2001, <https://uregina.ca/piwowarj/Think/ProcessingLevels.html>
Planet Labs, Martin Van Ryswyk, June 9, 2020, ‘Planet’s New Rapid Revisit Platform To Capture Up To 12 Images Per Day’, <https://www.planet.com/pulse/12x-rapid-revisit-announcement/>
World Economic Forum, ‘Who owns our orbit: Just how many satellites are there in space?’, October 23 2020, <https://www.weforum.org/agenda/2020/10/visualizing-easrth-satellites-sapce-spacex>
Illustrations:
[1] https://www.pngall.com/wp-content/uploads/9/Spacecraft-PNG-Free-Image.png
[3] https://cdn.pixabay.com/photo/2012/01/09/09/10/sun-11582_1280.jpg
[4] https://commons.wikimedia.org/wiki/File:Sulzberger_Ice_Shelf.jpg
[5] Sun, L.; Latifovic, R.; Pouliot, D. Haze Removal Based on a Fully Automated and Improved Haze Optimized Transformation for Landsat Imagery over Land. Remote Sens. 2017, 9, 972. https://doi.org/10.3390/rs9100972
[6] Scheirer, R.; Dybbroe, A.; Raspaud, M. A General Approach to Enhance Short Wave Satellite Imagery by Removing Background Atmospheric Effects. Remote Sens. 2018, 10, 560. https://doi.org/10.3390/rs10040560
[7] Kouyama, T.; Kanemura, A.; Kato, S.; Imamoglu, N.; Fukuhara, T.; Nakamura, R. Satellite Attitude Determination and Map Projection Based on Robust Image Matching. Remote Sens. 2017, 9, 90. https://doi.org/10.3390/rs9010090
[8] https://commons.wikimedia.org/wiki/File:World_map_longlat.svg
[9] https://commons.wikimedia.org/wiki/File:Mercator_Projection.svg
[10] https://commons.wikimedia.org/wiki/File:Paris,_France_(satellite_view).jpg


